Checking a prebuilt for bottlenecks means watching GPU and CPU utilization together while gaming, using free monitoring software, rather than guessing from spec sheets alone — a bottleneck happens when one component (usually the CPU) can’t feed data to another (usually the GPU) fast enough, leaving purchased performance unused. This guide walks through the exact tools and readings that reveal a bottleneck, and what to do once you’ve confirmed one.
I’m Marcus Reilly, and diagnosing exactly where a system’s performance ceiling comes from is a daily part of testing on my two-bench lab, using calibrated monitoring alongside in-game benchmarks to separate a genuine hardware bottleneck from a settings or software issue that looks similar at a glance but has a different fix entirely.
As an Amazon Associate we earn from qualifying purchases at no extra cost to you. Product prices and availability are accurate as of the date shown and are subject to change.





Top 3 picks at a glance
What a bottleneck actually is, in practical terms
A bottleneck occurs when one component limits the performance of another that’s otherwise capable of more — most commonly, a CPU that can’t prepare frame data fast enough to keep a GPU fully fed, resulting in the GPU sitting idle for portions of each second rather than rendering continuously at full capacity.
This is different from a GPU simply being too weak for a game’s settings, where the GPU itself is the limiting factor and shows near-100% utilization the entire time — in that case there’s no bottleneck in the technical sense, just a GPU working at its full capacity and still not reaching your target frame rate.
Bottlenecks aren’t binary — every system has some component that’s relatively more or less loaded than others at any given moment, and the practical question isn’t whether a bottleneck exists in some technical sense, but whether it’s severe enough to meaningfully waste money spent on a stronger component that isn’t being used to its potential.
Resolution changes bottleneck severity dramatically: the same CPU-GPU pairing that shows a clear CPU bottleneck at 1080p (where the CPU has to prepare far more frames per second relative to the lighter GPU workload) often shows little to no bottleneck at 4K, where the GPU’s workload increases enough to become the limiting factor regardless of CPU strength.
Understanding this resolution-dependence matters before you conclude a system is poorly matched — a build that looks CPU-bottlenecked at 1080p might be perfectly balanced for its intended 1440p or 4K use case, so always test at the resolution you actually plan to game at.
Setting up monitoring software correctly
MSI Afterburner paired with its RivaTuner Statistics Server component (both free) is the most common setup for an in-game overlay showing real-time GPU utilization, CPU utilization, frame rate, and temperatures simultaneously, without needing to alt-tab out of your game to check readings.
HWiNFO64 provides more detailed logging, including per-core CPU utilization and clock speed, useful for identifying whether a bottleneck stems from overall CPU load or a specific core being maxed out while others sit comparatively idle, which points toward a game engine’s threading limitations rather than raw CPU weakness.
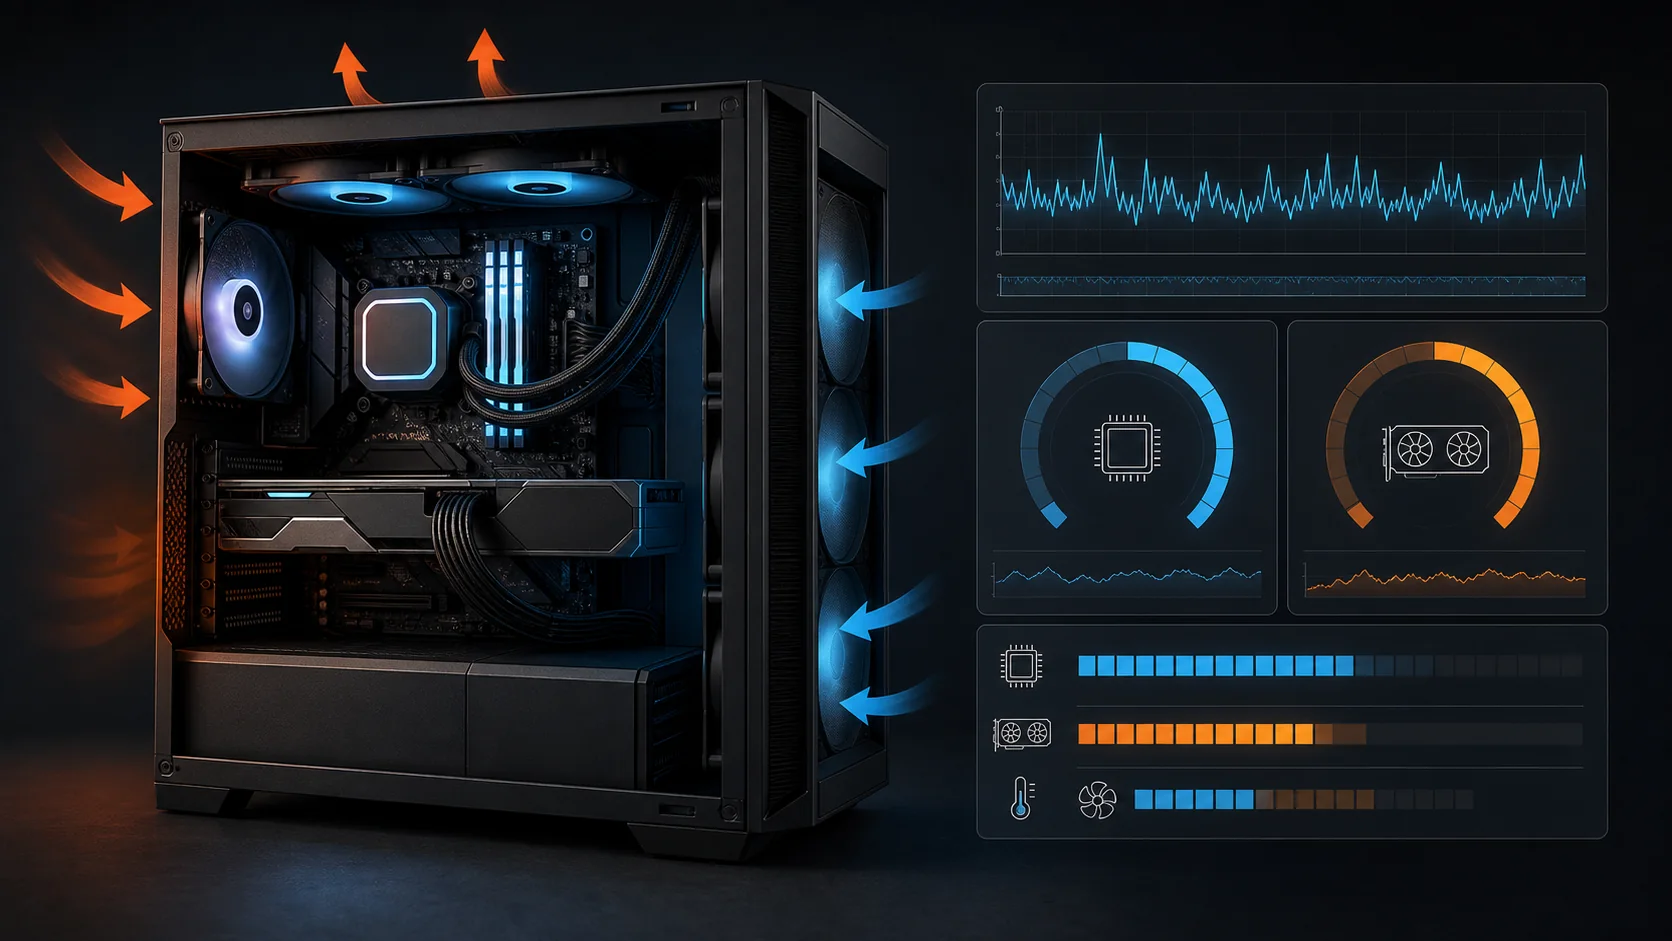
Configure your overlay to show, at minimum: GPU utilization percentage, average and per-core CPU utilization, current frame rate, and GPU/CPU temperatures — this combination is enough to diagnose the large majority of bottleneck scenarios without needing more specialized tools.
Test during actual representative gameplay rather than a main menu or loading screen, since utilization figures during non-gameplay moments don’t reflect real performance characteristics — ideally test for at least 10-15 minutes of normal play in a demanding area of your most-played game to get a representative reading rather than a brief snapshot.
Windows’ built-in Task Manager (Performance tab) provides a simpler, always-available alternative for a quick CPU and GPU utilization check, though it lacks the detailed per-core and temperature data that dedicated tools like HWiNFO64 provide for a more thorough diagnosis.
Reading GPU utilization: the primary bottleneck indicator
GPU utilization consistently at 95-99% during gameplay indicates the GPU is working at its intended capacity and is the limiting factor, which is the normal, expected, and desirable state for a well-matched gaming system — this means you’re getting the frame rate your GPU is actually capable of delivering at your current settings.
GPU utilization that frequently drops to 70-85% or lower, especially paired with one or more CPU cores near 100%, indicates the CPU can’t supply frame data fast enough to keep the GPU busy, which is the clearest sign of a CPU-side bottleneck — the GPU is capable of more but isn’t being given the opportunity to render at full pace.
Brief, occasional dips in GPU utilization are normal and don’t necessarily indicate a problem — loading a new area, a cutscene transition, or a momentarily CPU-heavy game event (many NPCs spawning at once, for example) can briefly reduce GPU load without indicating a systemic bottleneck throughout normal gameplay.
Pay attention to the pattern over time rather than a single instantaneous reading — a system that dips to 80% utilization briefly during specific scenes but sits at 97-99% the rest of the time has a much smaller practical bottleneck than one sitting at 75-80% utilization consistently throughout a session.
Comparing GPU utilization across different games is informative too — if a system shows healthy 95%+ utilization in most titles but drops significantly in one or two CPU-intensive genres (strategy games, simulation titles with many active entities), that’s a genre-specific bottleneck rather than a systemic hardware mismatch.
Reading CPU utilization: per-core detail matters
Average CPU utilization across all cores can be misleading on its own — a CPU showing 45% average utilization might still have one or two cores pegged at 100% while others sit largely idle, since many games don’t distribute workload evenly across all available cores, particularly older titles or those built on less modern game engines.
Per-core utilization data, available in HWiNFO64 or Task Manager’s detailed CPU view, reveals this pattern clearly — if any single core consistently shows 95-100% while GPU utilization is depressed, that core is likely the bottleneck even if the CPU’s overall average utilization looks moderate and unremarkable.
Games vary enormously in how well they use multiple cores, which is why the same CPU can show a clear bottleneck in one title and no bottleneck at all in another — modern, well-optimized titles built for current-generation engines generally distribute load more evenly across 6-8+ cores than older or less optimized games.
CPU clock speed under load is worth checking alongside utilization — if a CPU’s clock speed is unexpectedly low during gaming (below its rated boost clock) despite high utilization, that can indicate a thermal throttling issue rather than a pure architectural bottleneck, which has a different fix (better cooling rather than a CPU upgrade).
Our gaming PC power consumption explained guide covers how CPU boost behavior affects both power draw and sustained clock speed, relevant context for interpreting clock speed readings during a bottleneck diagnosis.
RAM and storage: less common but real bottleneck sources
RAM capacity shortages show up differently from CPU or GPU bottlenecks — rather than reduced utilization on one component, insufficient RAM (commonly under 16GB for current titles) causes stuttering, sudden frame time spikes, or the system falling back to using storage as virtual memory (paging), all detectable through frame time graphs in monitoring software rather than simple utilization percentages.
RAM configuration matters separately from capacity — a single stick running in single-channel mode reduces memory bandwidth significantly compared to a matched dual-channel pair of the same total capacity, and this can bottleneck integrated graphics severely or cause a smaller but measurable frame rate reduction on discrete GPU systems, particularly in memory-bandwidth-sensitive titles.
Check your RAM configuration using CPU-Z (free), specifically the “Memory” and “SPD” tabs, which show channel configuration, speed, and timings — a system showing “Single” instead of “Dual” channel mode with two or more sticks installed indicates they’re not correctly paired in matching slots, an easy but often-missed fix.
Storage bottlenecks are the least common of the three but still occur, primarily as load-time stutters (a brief freeze while new game assets stream in) rather than a sustained frame rate ceiling — this is most noticeable on traditional hard drives or in games with poorly optimized asset streaming, and less of a concern with a modern NVMe SSD.
If frame time graphs (available in most monitoring overlays) show periodic large spikes rather than a smooth, consistent line, that pattern often points toward RAM or storage-related stuttering rather than a pure CPU or GPU utilization bottleneck, and is worth investigating separately using the steps above.
Using online bottleneck calculators — and their real limitations
Online “bottleneck calculator” tools that estimate mismatch percentage based on CPU and GPU model names alone can offer a rough starting reference, but they rely on generalized benchmark averages across many games rather than your specific titles and settings, so treat their output as a loose approximation rather than an accurate diagnosis of your actual system.
These calculators typically can’t account for resolution, in-game settings, or which specific games you play — all factors that meaningfully change real-world bottleneck severity, as covered earlier in this guide, which is why direct monitoring during your actual gameplay remains a more reliable diagnostic method than any calculator-based estimate.
A calculator suggesting a “25% bottleneck” doesn’t translate directly to a 25% frame rate loss in practice, since the actual impact varies enormously by game and resolution — use these tools at most as a rough sanity check before buying components, not as a substitute for testing your actual system once assembled.
If you’re pre-planning a build or upgrade rather than diagnosing an existing system, pairing GPU and CPU tiers using tested, reviewed combinations — like those in our best gaming PC with RTX 5070 guide — is more reliable than a generic calculator’s percentage estimate.
Common bottleneck patterns by build type
Budget prebuilts pairing a mid-range GPU with an older or lower-core-count CPU to hit a price point is the most common bottleneck pattern I see in reviews — a strong GPU number attracts buyer attention while the CPU, less prominently featured in marketing, quietly limits real-world performance, especially at 1080p.
High-refresh-rate 1080p builds are particularly prone to CPU bottlenecks, since chasing 200+ fps at a lower resolution shifts relative load toward the CPU (which has to prepare far more frames per second) even with a capable GPU, making CPU choice more important for this use case than for higher-resolution, lower-frame-rate targets.
4K-focused builds are the least prone to CPU bottlenecks, since the GPU workload at 4K is high enough that even a modest CPU rarely becomes the limiting factor — this is why budget prebuilts sometimes pair a strong GPU with a weaker CPU specifically for 4K use cases, a combination that would show a clear bottleneck at 1080p but performs reasonably at 4K.
Older prebuilts upgraded with a new GPU but an unchanged, aging CPU are a common source of post-upgrade disappointment, where the new GPU’s performance is significantly limited by a CPU platform that was already a few generations old before the upgrade — this is the exact scenario our how to upgrade a prebuilt gaming PC guide addresses in its bottleneck-check step before recommending a GPU purchase.
What to do once you’ve confirmed a bottleneck
If your diagnosis points to a CPU bottleneck, first check whether background processes are contributing unnecessarily — closing browser tabs, streaming software, or other CPU-intensive background applications can free up meaningful CPU headroom without any hardware change, worth ruling out before assuming a hardware upgrade is required.
If background processes aren’t the cause and the bottleneck is confirmed as a genuine CPU limitation, a CPU upgrade (if your motherboard socket supports a stronger option) or, in more severe cases, a CPU and motherboard upgrade together, is the direct fix — though it’s worth calculating whether that cost approaches a full system rebuild before committing to it.
If the bottleneck is resolution-dependent — significant at 1080p but minimal at your actual target resolution of 1440p or 4K — no action may be necessary at all, since the system is performing as intended for your real use case, and the “bottleneck” only shows up in a resolution you don’t actually game at.
If a RAM configuration issue (single-channel instead of dual-channel) is the cause, adding a matched second stick in the correct motherboard slot is typically a $20-$40 fix that resolves the specific memory bandwidth limitation without requiring any other hardware change.
Our how to upgrade a prebuilt gaming PC guide covers the specific upgrade paths and priority order for each of these scenarios in more depth, including cost estimates for CPU, RAM, and storage fixes.
Troubleshooting: confusing readings and edge cases
If GPU utilization looks high (95%+) but frame rate is still lower than expected for your hardware tier, the issue likely isn’t a traditional bottleneck at all — check in-game settings for an unusually demanding option enabled (ray tracing, extreme shadow quality) that’s legitimately taxing the GPU rather than a mismatch between components.
If utilization readings fluctuate wildly and inconsistently rather than showing a clear pattern, extend your monitoring session to at least 15-20 minutes across varied gameplay moments, since a short test window can catch an atypical scene (a cutscene, loading transition, or unusually CPU-heavy one-off event) that doesn’t represent overall system behavior.
If a bottleneck appears in one specific game but not others on the same hardware, that’s normal and expected — game engine optimization varies enormously, and a single problematic title’s bottleneck doesn’t necessarily indicate your overall system is poorly matched for your broader game library.
If you suspect a bottleneck but monitoring software shows both GPU and CPU utilization comfortably below 90% simultaneously, the limiting factor may be a frame rate cap (in-game, driver-level, or from V-Sync) rather than a hardware bottleneck at all — check your frame rate limiter settings before concluding a hardware issue exists.
Frequently asked questions
What’s the fastest way to check if my CPU is bottlenecking my GPU?
Open a free monitoring overlay like MSI Afterburner or HWiNFO64 while playing your usual game, and watch GPU utilization: if it consistently sits below roughly 95% while your CPU shows one or more cores near 100%, your CPU is likely the limiting factor rather than the GPU, especially at 1080p or 1440p resolution.
Does a CPU bottleneck matter less at higher resolutions?
Yes, because higher resolutions shift more of the workload onto the GPU, so a CPU that bottlenecks a system at 1080p often shows little to no bottleneck at 4K, since the GPU becomes the limiting factor regardless of CPU strength at that resolution; this is why bottleneck severity depends heavily on your target resolution.
Can RAM cause a bottleneck even if I have enough total capacity?
Yes, single-channel RAM configurations (one stick instead of a matched pair) reduce memory bandwidth significantly even with adequate total capacity, and RAM speed mismatches with your CPU’s supported specification can also limit performance, so capacity alone doesn’t guarantee RAM isn’t a limiting factor.
What GPU utilization percentage indicates a healthy, non-bottlenecked system?
GPU utilization consistently at 95-99% during actual gameplay generally indicates the GPU is the limiting factor as intended, which is the normal and expected state for a well-matched gaming PC; utilization frequently dropping to 70-85% or lower while a CPU core sits near 100% points to a CPU-side bottleneck instead.
Is some bottleneck always acceptable, or should I aim to eliminate it completely?
A small amount of bottleneck is normal and often unavoidable, since perfectly balanced CPU-GPU pairing across every game and resolution isn’t realistic; the goal is avoiding a severe, consistent bottleneck (GPU utilization regularly below 80-85%) that leaves a meaningful portion of your GPU’s purchased performance unused.